Port figures

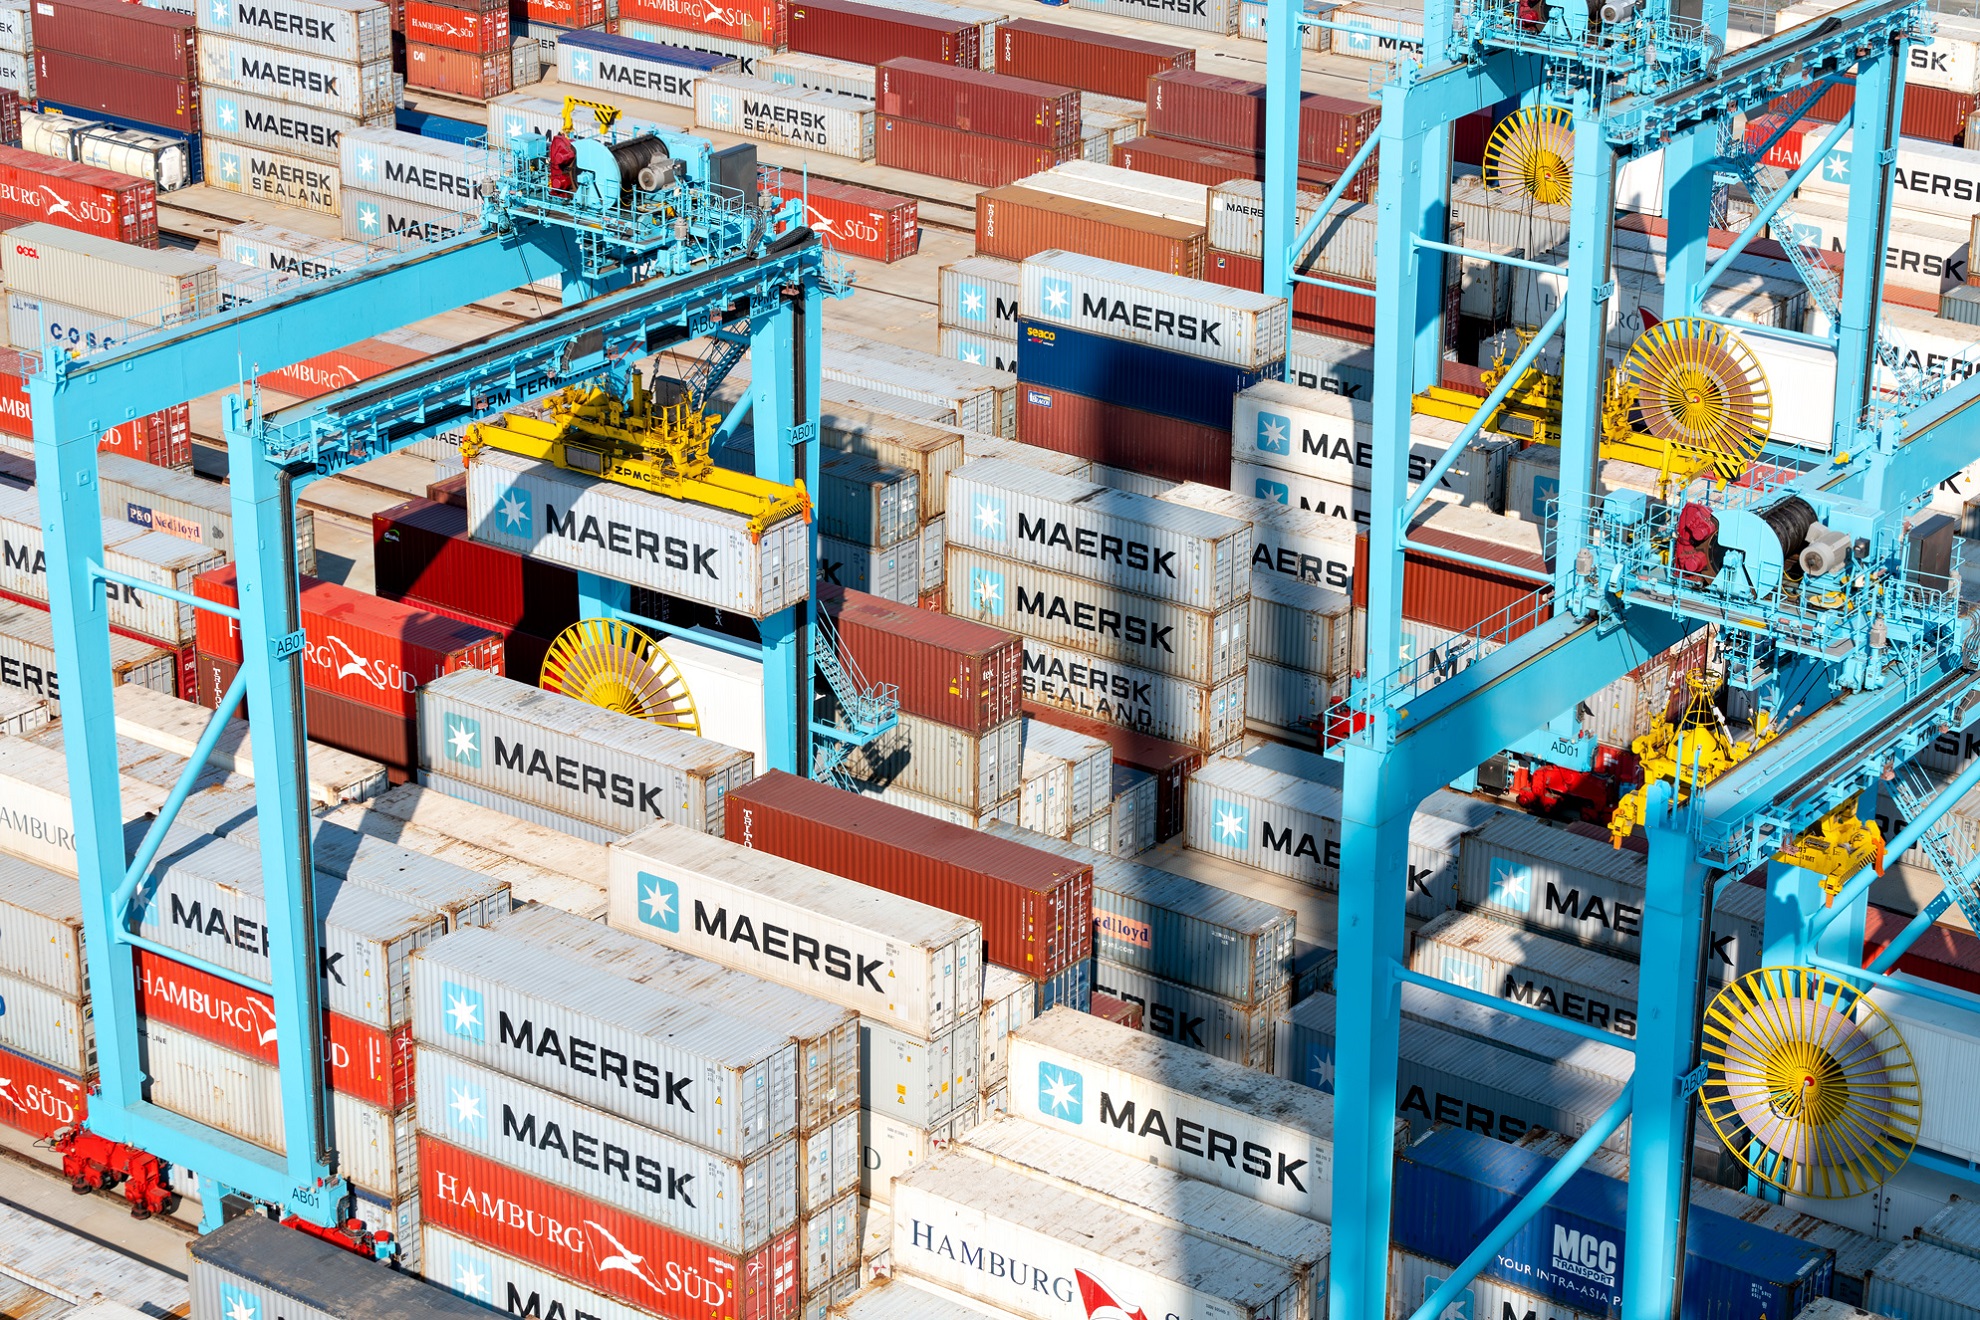
The Ports of Genoa consolidates its leading role in container handling, with volumes firmly back to pre-pandemic levels, up +0.6% on 2021 at 2.8 million TEUs. Total containerised tonnage rose by +3.5%, with gateway box traffic registering an increase of +4.1% compared to 2021, thereby establishing Genoa, Savona and Vado-Ligure as premier maritime hub for Northern Italy's manufacturing and consumer heartland.

For the third consecutive year, the growth in container traffic has boosted the port's modal split, up to 16.6% by rail, with a major concentration in the Vado Ligure and Genova Pra' terminals which reported respectively a 22% and 19% rate, in line with EU mid-term targets. In 2022 the Ports of Genoa registered a total of 418,695 TEUs freighted by over 10,000 rail cars, a +10.1% advance on the previous year.

Positive results across the board: the Ports of Genoa, Savona and Vado-Ligure responded robustly to the uncertainties which have blighted international trade in the latter part of the year and confirmed a +4.2% advance in total cargo throughput to 66,226,597 tons. One of the port's leading commodity segments, conventional general cargo which includes the ro-ro product group, continued along an upward trend, rising to almost 14.6 million tons, +4.9% compared to 2021.

The solid bulk industry continues to show signs of recovery across the past year, with a +0.7 increase reported on 2021, registering a total of 2,538,691 tons.

Liquid bulk continues to perform strongly, an upturn of + 8.6% compared to the previous year, with Savona-Vado Ligure recording 6.3 million tons and Genoa almost 13 million tons.

Passenger traffic, which remains the port sector to have been most severely impacted by the repercussions of the pandemic, finally experienced a surge in numbers, specifically in the last six months of the year. The ferry terminals handled a total of 2,661,442 passengers, a jump of +40.3% on the previous year and an improvement on pre-Covid 2019. The cruise terminals reported a passenger count of 1,571,567, pointing to a rebound in the industry, with a +10% increase in cruise calls compared to 2019, thereby consolidating the Ports of Genoa and Savona's third-post ranking amongst the top Mediterranean cruise hubs.

Total throughput
0
.2
mln tons
TOTAL THROUGHPUT
General cargo
0
.6
mln tons
Ro-Ro Tonnage
Containerized cargo
0
.6
mln tons
CONTAINERIZED CARGO
Dry bulk
0
.9
mln tons
DRY BULK
Liquid bulk
0
.3
mln tons
LIQUID BULK
Loaded cargo
0
.6
mln tons
LOADED CARGO
Unloaded cargo
0
.8
mln tons
UNLOADED CARGO
Ship calls
0
,448
units
SHIP CALLS
TOTAL THROUGHPUT

TOTAL THROUGHPUT

CONTAINER TRAFFIC

CONTAINER TRAFFIC

Cruise Passenger Traffic

Cruise Passenger Traffic

 Ferry Passenger Traffic

Ferry Passenger Traffic

CONTAINER TRADE PARTNERS

CONTAINER TRADE PARTNERS

WESTERN LIGURIAN SEA PORT AUTHORITY STATISTICS

Year 2023

Traffic Ports of Genoa – March 2023 (pdf - 50.74 Kb )
Traffic Ports of Genoa – February 2023 (pdf - 50.76 Kb )
Traffic Ports of Genoa – January 2023 (pdf - 50.25 Kb )

Year 2022

Traffic Ports of Genoa – December 2022 (pdf - 155.38 Kb )
Traffic Ports of Genoa – November 2022 (pdf - 156.28 Kb )
Traffic Ports of Genoa – October 2022 (pdf - 156.29 Kb )
Traffic Ports of Genoa – September 2022 (pdf - 156.28 Kb )
Traffic Ports of Genoa – August 2022 (pdf - 156.27 Kb )
Traffic Ports of Genoa – July 2022 (pdf - 56.74 Kb )
Traffic Ports of Genoa – June 2022 (pdf - 156.01 Kb )
Traffic Ports of Genoa – May 2022 (pdf - 155.2 Kb )
Traffic Ports of Genoa – April 2022 (pdf - 156.28 Kb )
Traffic Ports of Genoa – March 2022 (pdf - 56.67 Kb )
Traffic Ports of Genoa – February 2022 (pdf - 156.22 Kb )
Traffic Ports of Genoa – January 2022 (pdf - 155.34 Kb )

Year 2020

Traffic Volumes Q4 2020 (pdf - 4.91 Mb )
Traffic Ports of Genoa – December 2020 (pdf - 164.53 Kb )
Traffic Ports of Genoa – November 2020 (pdf - 164.53 Kb )
Traffic Ports of Genoa – October 2020 (pdf - 164.54 Kb )
Traffic Ports of Genoa – September 2020 (pdf - 164.5 Kb )
Traffic Ports of Genoa – August 2020 (pdf - 164.48 Kb )
Traffic Ports of Genoa – July 2020 (pdf - 164.64 Kb )
Traffic Ports of Genoa – June 2020 (pdf - 164.96 Kb )
Traffic Ports of Genoa – May 2020 (pdf - 164.47 Kb )
Traffic Ports of Genoa – April 2020 (pdf - 164.46 Kb )
Traffic Ports of Genoa – March 2020 (pdf - 164.43 Kb )
Traffic Ports of Genoa – February 2020 (pdf - 164.43 Kb )
Traffic Ports of Genoa – January 2020 (pdf - 164.26 Kb )

Year 2021

Traffic Volumes Q4 2021 (pdf - 6.72 Mb )
Traffic Ports of Genoa – December 2021 (pdf - 156.14 Kb )
Traffic Ports of Genoa – November 2021 (pdf - 155.75 Kb )
Traffic Ports of Genoa – October 2021 (pdf - 155.71 Kb )
Traffic Ports of Genoa – September 2021 (pdf - 155.79 Kb )
Traffic Ports of Genoa – August 2021 (pdf - 155.7 Kb )
Traffic Ports of Genoa – July 2021 (pdf - 155.84 Kb )
Traffic Ports of Genoa – June 2021 (pdf - 164.79 Kb )
Traffic Ports of Genoa – May 2021 (pdf - 155.77 Kb )
Traffic Ports of Genoa – April 2021 (pdf - 155.74 Kb )
Traffic Ports of Genoa – March 2021 (pdf - 155.76 Kb )
Traffic Ports of Genoa – February 2021 (pdf - 155.77 Kb )
Traffic Ports of Genoa – January 2021 (pdf - 155.54 Kb )

PORTS OF GENOVA AND PRA' STATISTICS

The desired information can be searched by specifying one or more criteria in the search boxes, then pressing "Search".

TRAFFIC THROUGH THE PORT OF GENOA DIVIDED PER PORTS - LOADING/UNLOADING

BREAKDOWN OF TRAFFIC BY PORT

Classification of top 61 ports connected with the Port of Genoa (Total traffic in metric tons)

ANNUAL TOTAL TRAFFIC VOLUMES

Traffic throught the Port of Genoa

PORTS OF SAVONA AND VADO LIGURE STATISTICS

The desired information can be searched by specifying one or more criteria in the search boxes, then pressing "Search".